Data Mining and Airline Safety
In today's post, we examine the use of data mining to improve airline safety. Over the past several decades, air travel has become, statistically, one of the safest modes of transportation. In the following chart, you will observe that there has been a substantial decline in the fatal accident rate from 1950 through about 1980, even though the actual number of departures has increased significantly:
[Source: Handbook of Statistical Analysis and Data Mining; Nisbet, Elder, Miner, pp 378]
Since 1980 however, the decline in fatalities has somewhat stabilized which probably indicates that new thinking and new safety approaches are needed to further push down the rate of fatalities. One such approach could be the use of data mining in determining the causes of fatalities so that preventative action may be taken. In this post, we will use publicly available data on airline safety to identify main causes of accidents and thereafter identify which the main predictors of accidents are. Needless to say, for the purposes of this post, we will keep our analysis simplistic merely to prove that data mining is a useful tool in conducting this analysis.
Data Understanding
We download the data sets from the website (http://av-info.faa.gov/dd_sublevel.asp?Folder=\SDRS) of the Federal Aviation Administration (FAA) which among other reports contains a series of reports called the Service Difficulty Reports (SDRs). An SDR is required to be filed by an operator following an event with an aircraft, such as a malfunction, defect, failure, etc. There are several outcomes that follow an event, one of which is an Unscheduled Landing. Today, we will mine the data to see if we can identify the main causes of Unscheduled Landings.
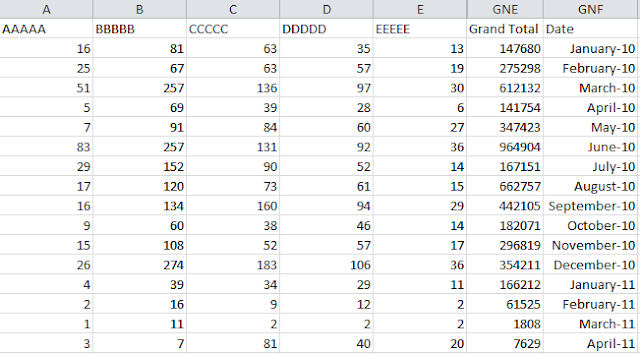
The data consists of the following fields:
As can be seen from the tables above, there are several variables captures by the SDR. In order to identify which variables we should use to determine unscheduled landings, there are two approaches:
1) Discuss these variables with an industry expert who can come up with a shortlist of independent variables that are likely to influence unscheduled landings;
2) Use the feature selection node in SPSS Modeler to identify the major influencers based on the data available.
A mix of these two approaches is probably the best course of action. For the purposes of this exercise, we will use the following fields:
1) C14: "Region code";
2) C130: "Aircraft manufacturer's name";
3) C160: "Region responsible for aircraft"; and
4) C330: "Stage of operation code".
Data Preparation
The next step in the data mining process is to prepare the data for mining. This step often takes the most amount of time in the data mining process. In order to prepare the data, I used Microsoft Excel. The two main steps that I took in excel were as follows:
1) Create a target field or a dependent variable: From the table above, we can see that the fields 314a through 314d represent Precautionary Procedures that were taken by the air carrier. We create a new field in Excel using an IF function. If any of the four fields contain the text "Unscheduled Landing", then the target field is marked "Yes", else it is marked "No".
2) Getting rid of trailing spaces: Trailing spaces in cells must be removed to avoid issues in modeling. This is done using the TRIM function in excel.
After these and a few other minor steps, our data is now ready for modeling.
Modeling
In order to model the data, we have our target field (or dependent variable), which we created above using the IF function in excel. Our input fields are the four fields we identified under the Data Understanding section. In order to remove the remaining fields from our analysis, we use the Filter node in SPSS Modeler. We then add a Type node, where we identify the target field. We then attach the Auto Classifier modeling node to the Type node and execute the node.
SPSS Modeler simultaneously executes several classification algorithms and returns a list of the top three algorithms ranked on the overall accuracy of predicted versus observed results.
Evaluation
The top three models (algorithms) as well as their accuracy for the training data set is as follows:
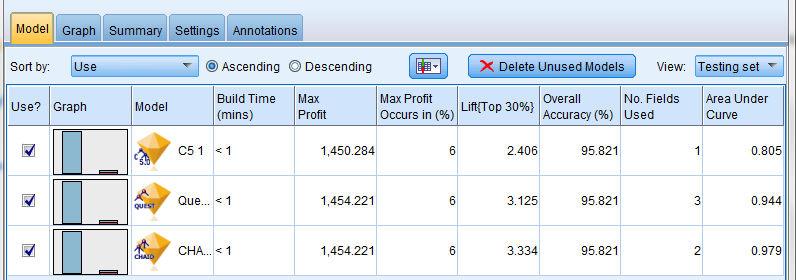
Similarly, the top three models (algorithms) as well as their accuracy for the testing data set is as follows:
As can be seen, each of the three models (algorithms) have extremely high accuracy %s for both training and testing data sets. We now have the option of choosing one, two or all three models to conduct the remainder of our evaluation. If we choose more than one model, SPSS Modeler creates an ensemble model and provides those results to us. For the purposes of this exercise, we use all three models to conduct our analysis.
Two additional charts that assist us in determining the quality of our models are as follows:
Analysis chart including the co-incidence matrices that show the Type I and Type II errors in our models along with the overall accuracy:
A lift or gains chart:
For a detailed explanation on how to interpret this chart, please see here.
Since the reason behind our analysis was to identify the reasons for unscheduled landings, we look at the following chart that lists the predictors (or independent variables) in order of importance:
From this chart, we observe that the most important predictors for unscheduled landings in decreasing order of importance are:
1) C330: "Stage of operation code" (takeoff, approach, landing, cruising, etc);
2) C160: "Region responsible for aircraft";
3) C130: "Aircraft manufacturer's name"; and
4) C14: "Region code".
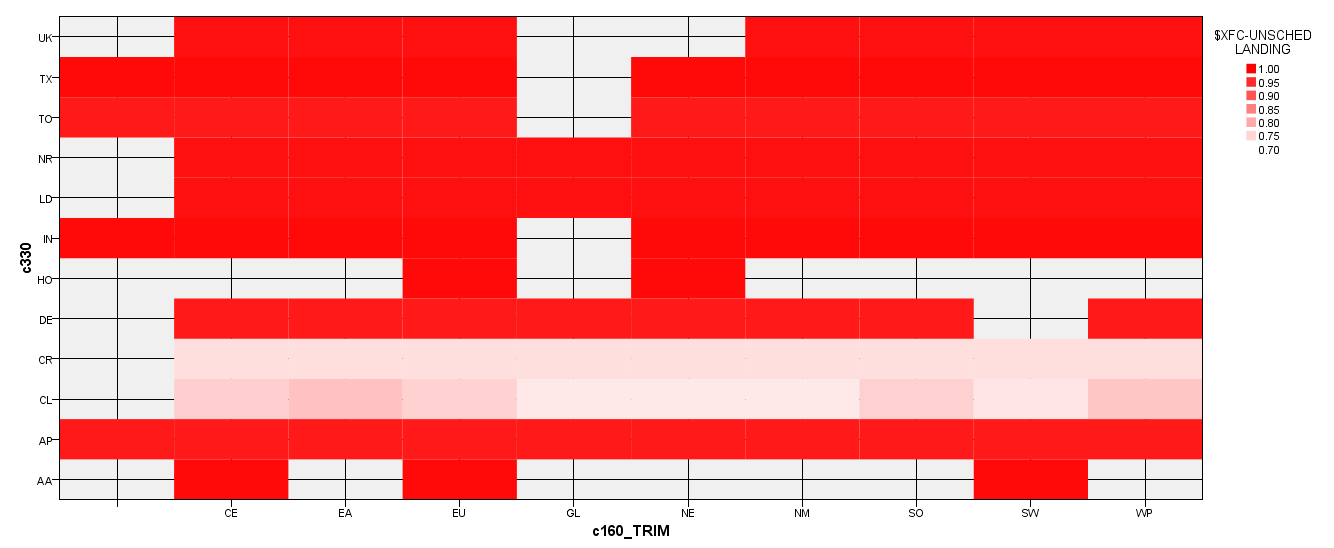
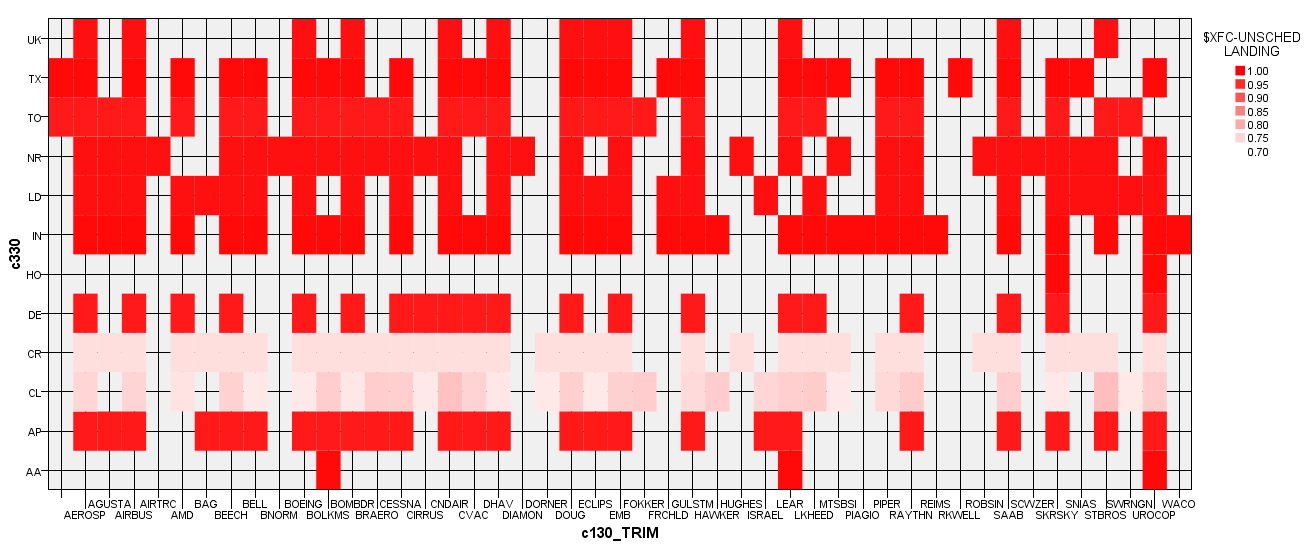
Let us examine C330 in further detail with the aid of the following heat maps:
Stage of operation code by Region responsible for aircraft:
Stage of operation code by Aircraft manufacturer's name:
Stage of operation code by Region code:
The colors in the heat maps above refer to the probability of occurrence of unscheduled landings. The darker the shade of red, the higher the probability of occurrence of an unscheduled landing and vice versa. These heat maps provide invaluable insight for decision makers and investigators as they attempt to prevent future unscheduled landings.


Comments
Post a Comment