Posts

Showing posts from September, 2017

Homoscedasticity and heteroscedasticity

Image
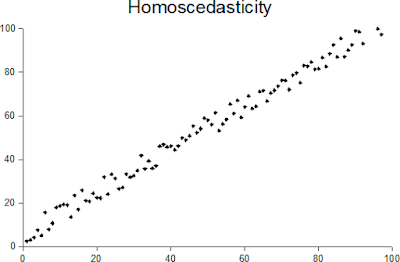
Homoscedasticity and heteroscedasticity - two of the scariest sounding terms in all of Statistics!  So what do they mean? When one calculates the variance or standard deviation of a dataset of random variables, one assumes that the variance is constant across the entire population.  This assumption is homoscedasticity.  The opposite of this assumption is heteroscedasticity. In other words, a collection of random variables is heteroscedastic if there are sub-populations within the dataset that have different variances from others (source: https://en.wikipedia.org/wiki/Heteroscedasticity).  Another way of describing homoscedasticity is constant variance and another way of describing heteroscedasticity is variable variance. Jeremy J Taylor  in his blog  provides a great example of a distribution that is heteroscedastic.  In his example, the independent variable is "age" and the predictor variable is "income".  The example discusses how incomes

Standard Deviation versus Absolute Mean Deviation

Image
One of the first things that any student of statistics learns is 2 popular measures of descriptive statistics: mean and standard deviation. Has the approach to calculating Standard Deviation ever got you wondering about the need to square the distances from the mean in order to remove negatives instead of just using the average of the absolute values to eliminate negatives?  Well, you are certainly not alone. As it turns out, squaring the distances from the mean and then calculating their square root to arrive at the Standard Deviation of a distribution is more as a result of convention than anything else.  In fact, there is a measure called the Absolute Mean Deviation that does not take the squared distances from the mean to eliminate negative values.  Instead, it just takes the absolute values of the differences from the mean and calculates the average of the sum of those values to determine deviation from the mean. The convention of course is to use Standard Devia

Basic Statistics in R

M y  latest publicly available R notebook  created in  IBM's Data Science Experience  is  here !  This notebook provides a tutorial on: This notebook covers: Descriptive statistics Frequency and contingency tables Correlations and covariances t-tests; and Nonparametric statistics. I hope you enjoy this  notebook .  Please feel free to share and let me know your thoughts. My latest R notebook: Basic #Statistics in R https://t.co/b3NmhNXI5X #DataScience #dsx #IBM #Bluemix #ibmaot #rstats h/t @kabacoff pic.twitter.com/AsIhr51Q5l — Venky Rao (@VRaoRao) September 13, 2017

Adding a .RData file to DSX in 5 easy steps

I created a tutorial to show how users can add a .RData file to an R Jupyter Notebook in IBM's Data Science Experience (DSX) in 5 easy steps. My latest #R #notebook : Add a .RData file to a DSX R Notebook in 5 steps https://t.co/uznXwZWKSv #dsx #IBM #DataScience #rstats #ibmaot pic.twitter.com/plKuTwYDwt — Venky Rao (@VRaoRao) September 13, 2017

Basic graphs in R

M y  latest publicly available R notebook  created in  IBM's Data Science Experience  is  here !  This notebook provides a tutorial on: Bar, box and dot plots Pie and fan charts Histograms and kernel density plots. I hope you enjoy this  notebook .  Please feel free to share and let me know your thoughts. My latest #R #notebook : Basic Graphs in R https://t.co/o7j97GwEUL #DataScience #dsx #IBM #ibmaot h/t @kabacoff pic.twitter.com/MBfZQgg4Y0 — Venky Rao (@VRaoRao) September 4, 2017

Advanced Data Preparation in R

M y  latest publicly available R notebook  created in  IBM's Data Science Experience  is  here !  This notebook addresses some advanced features available in R focusing on Data Preparation. I hope you enjoy this  notebook .  Please feel free to share and let me know your thoughts. My latest #R #notebook : Advanced Data Preparation in R https://t.co/7Dvc9nCPK0 #DataScience #dsx #ibmaot #IBM h/t @kabacoff pic.twitter.com/cNpP45vpoR — Venky Rao (@VRaoRao) September 2, 2017