Customer Profiling (guest author: Paul Cook)
Profiling is a data mining technique used
to find patterns and trends in customer data. In today's post we will explore
the application of this technique.
As we will demonstrate in this article,
profiling is both simple and powerful. Its great strength is its simplicity. It
is ideal for communicating large amounts of information in a user-friendly way.
Profiles are clear, comprehensive, and easy to read, which makes them ideal for
communicating with a business or non-technical audience.
Profiling describes a group of people by
summarizing information about them. Profiles are typically used to answer
questions like:
- What do my customers look like?
- Which prospects are most likely to buy?
- What drives customer churn?
Often, a profile is all you need to answer
these questions. Other times, you may choose to use a profile for exploratory
data analysis before multivariate modelling.
Profiling is often used to find hot
prospects for marketing campaigns. By comparing past purchasers and
non-purchasers, you can see what's different about the purchasers. These
differences can be combined into a statistical
model, and the effectiveness of the model measured using gain
and lift charts. When building a model, a profile is used to show the
effect of the variables included in the analysis.
Today's tutorial was created using a profiling add-on for IBM
SPSS Statistics, though you can also build profiles in Excel if you prefer.
In today's tutorial, we will start with the most basic type of profile, and
build up to the more sophisticated applications.
The simplest form of profile describes one
group of customers, like the example below.
This is, of course, a greatly simplified
example. Real profiles may contain dozens or even hundreds of variables, and thousands
to millions of customers. Nonetheless, from this example, it is immediately
apparent that this business's base is skewed towards older, affluent, male
customers.
The above example contains just counts of
customers. Often, you would want to examine other statistics too, like counts,
averages, maximums, standard deviations, and so on. The next example presents
the same customers, but this time showing both sample sizes (N) and average
profit per customer (MEAN).
We saw before that this customer group
tends to be older, affluent, and male. But when we look at the profitability
figures, see how the most profitable customers tend to be less affluent and
female. This raises questions for the business's marketing strategy. Could the
business increase profitability by targeting women and the less affluent market
sectors?
A common use of profiling is to compare and
contrast one customer group against another—often comparing a customer segment
to the entire customer base, to see what's different and special about the
segment.
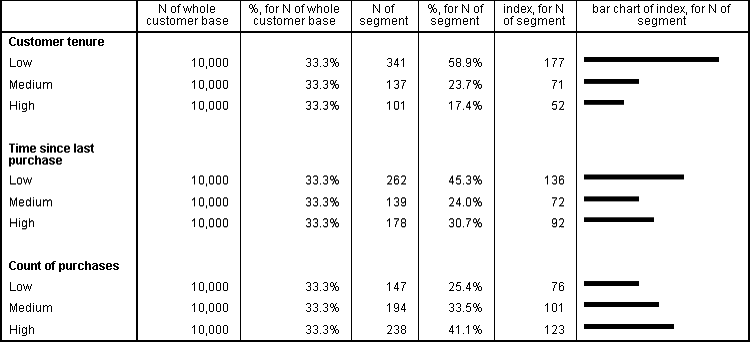
In the profile above, the customer base has
been split into three equal-sized groups of 10,000 each, and a customer segment
is compared using an index, which is also graphed as a bar chart. This shows
that the segment being investigated is skewed towards new customers who have
purchased recently and made multiple purchases.
Comparisons like these are perfect for
answering ad hoc questions like "what's different about high-value
customers?" or "how do recent recruits differ from existing
customers?" They are also perfect when using clustering to create new
segmentation schemes.
Marketers are always searching for market
segments that are highly responsive to their offers and promotions. To find
these responsive segments, profiles of response rates are used, as shown below.
In this example, z-scores have been
calculated to highlight particularly high or low response rates. The profile
above shows that the number of cars a person owns is strongly associated with
response: the more cars a person owns, the more likely they are to respond.
Using exactly the same technique, you can
profile response rates, cross-sell rates, attrition rates, and so on.
As we have seen, profiling is both
beautifully simple and extremely powerful. And best of all, it can now be done
in seconds using automated profiling tools.


Comments
Post a Comment