Predicting Telco Churn using Binomial Logistic Regression
In today's post, we will use a sample data set from a fictitious telecommunications company with the objective of predicting customer churn. Churn refers to the loss of customers to another company. A large percentage of subscribers signing up with a new wireless carrier every year are coming from another wireless provider and hence are already churners. It costs hundreds of dollars to acquire a new customer in most Telecom industries. So when a customer leaves, the company loses not only the future revenue from this customer but also the resources spent on customer acquisition in the first place.
Given this background, having the ability to predict potential churners before they churn and making them an offer that would get them to stay is an extremely valuable proposition. Let us see how we can do this using a Binomial Logistic Regression model in SPSS Modeler.
To start with, we take our sample data set from a fictitious telco. The data contains 42 fields that include information typically found in a CRM system: age, tenure, income, address, education, type of service, customer category and finally whether the customer churned or not (0 = did not churn; 1 = churned). The distribution between churn and did not churn is as follows:
From the chart we can see that of the 1,000 customers that we have data for, 274 or 27.4% churned.
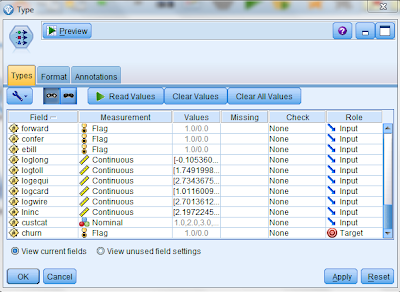
Having got a sense for the data that we have, we can now commence our analysis. The first step in this process is to clearly identify the measurement type for each of these fields. We do this using a type node as follows:
We set the measurement type of all the fields that have a value of 1 or 0 to "flag" (except gender which we retain as nominal since 1 or 0 in this case refers to a string value). We also set the measurement type of the churn field to flag and set its role to Target. All other fields are treated as Inputs:
Given the large number of input variables and in order to make the processing efficient, we use a Feature Selection node to identify which predictors are important. The results of the feature selection node appear as follows:
We then use a filter node to only choose those fields deemed important by the Feature Selection node and ignore the other fields in our analysis. An easy way to do this is to generate the filter node directly from the output of the feature selection node by choosing "Generate" and then "Filter".
We the run a data audit on the filter node to check the quality of the data we have for modeling. On reviewing the results of the data, we see that while most of the fields are 100% populated with data, the field "logtoll" is only 47.5% complete:
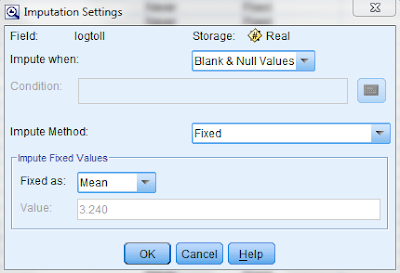
We impute all the missing and null values in this field with the mean of all the current values by specifying the condition as follows:
We then generate a Missing Values Supernode through the Data Audit Quality tab by choosing "Generate" and then "Missing Values Supernode". We are now ready to commence modeling.
In order to do this, we add a Logistic modeling node to the Missing Values Supernode. In the Logistic node Model tab, we choose the following options:
Because the target variable has two distinct categories (0 = churn; 1 = not churn), we choose the Binomial procedure. If the target field had multiple categories, we would have chosen the Multinomial procedure. We also choose the Forwards method for our analysis. Choosing the Forwards method means that the model is built in steps with the first step being a simple model no variables in the model, testing the addition of each variable using a chosen model comparison criterion, adding the variable (if any) that improves the model the most, and repeating this process until none improves the model (source: Wikipedia).
In the expert tab, we choose the following options:
Choosing Iteration History ensures that the results will show the forwards stepwise process followed by SPSS in determining the final model. In the Analyze tab, we choose the following options:
By choosing this option, the predictors are listed in order of importance when we review the results of the model.
We now run the model and evaluate the results. In the model tab, we see the predictor importance displayed as follows:
The summary tab displays the target field and the final list of inputs used in generating the model as follows:
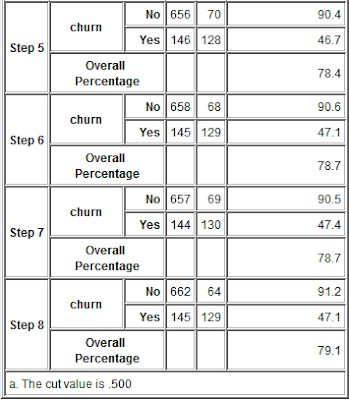
The advanced tab shows the stepwise results of the forwards logistic regression process:
From the results, we observe as follows:
1) In Step 0, the model was able to predict those who did not churn 100% of the time but was unable to predict those customers that would churn. As a result, additional variables were added to the forwards regression process.
2) As more variables are added in steps 1 through 8, we see the predictive ability of the model improve such that at the end of step 8, we are able to predict with a 47.1% accuracy, those customer likely to churn. This is a huge improvement over where we were. If a telco could predict with a 50% accuracy those customers likely to churn and with a 90% accuracy those unlikely to churn, there would be huge improvements in their ability to monitor and control churn.
A couple of important points to note:
1) In this case, the overall accuracy of the predictive model is less important than the predictive accuracy in each churn category, i.e. in some of the steps above, we see the overall accuracy drop but the regression process continues since we are trying to improve categorical accuracy.
2) The cut value in this case is 0.500. Given that this is a classification model, SPSS Modeler generates a % likelihood of churn. For the purposes of our analysis, we decided that where the likelihood was >0.500, that would be classified as churn and anything <0.500 would be classified as not churn. The cut off value is specified in the following location: Logistical model, Expert tab, Output options, Classification Cutoff (see image above).
The outcome of this analysis is as follows:
1) By identifying those customers most likely to churn, the telco can make them customized offers that would encourage them to stay with the company.
2) Since these offers can be targeted only to those that are likely to churn, the telco does not waste resources by sending the offer to its entire customer base. It also does not spam those customers that are not likely to churn with offers they are not interested in. The gains chart as a result is as follows:
3) SPSS Modeler can also be used to identify interesting relationships between different variables. An example is provided below:
In the heat map above, we plot likelihood of churn against two criteria: education and customer category. Assuming education codes mean the following: 1 = elementary school, 2 = middle school, 3 = high school, 4 = under grad and 5 = post grad; and customer categories mean the following: Value 1 = Basic Service, Value 2 = E-service, Value 3 = Plus Service and Value 4 = Total Service. One look at the heat map will tell the marketing department that Plus Service customers are highly likely to churn across the board and perhaps the entire Plus Service offering needs to be re-examined. Similarly it appears that the offer that the telco currently has for those customers who have only completed elementary school education is not ideal because once again, across the board, their likelihood of churn is very high.










thank you for your sharing,
ReplyDeletebut how to apply this model to current customer (active customer), so we can know the prediction which customer will churn?
thanks
The model is trained on past data. The trained model is then used to make predictions on current customer churn.
Deleteyou learn from the past (with an outcome - churn/no churn - already known) and then apply your model (from which you know, which factors increase churn and which lower it) to the current data you have
ReplyDeletethanks for clarifying.
Deleteif i use spss modeler and i am using data of existing customers, what will i do so that spss modeler will tell me which customer will churn and which ones will not?
ReplyDeletethanks
The model is trained on past data. The trained model is then used to make predictions on current customer churn. Read my blog on model scoring: http://themainstreamseer.blogspot.com/2011/10/scoring-model-in-spss.html
DeleteHello! Someone in my Facebook group shared this website with us, so I came to give it a look. I’m enjoying the information. I’m bookmarking and will be tweeting this to my followers! Wonderful blog and amazing design and style.
ReplyDeleteSurya Informatics
Thanks for sharing this article, Data have become more important than ever, everywhere! Data in Gaming Industry also plays a major role in a platform's success. That being said, What do you think about its role in the gaming industry?
ReplyDeleteI think marketing automation software's will help reduce churn rate like never before. Can it be deployed like this article?
Customer Churn
Online gambling has become more popular over the last couple of years with the increase in technology and the internet has made it easier than ever before to play Gambling. Click here to know more about churn prevention software.
ReplyDelete