Producing a map with 5 lines of code
Over the past year, I have been exploring the geospatial capabilities of various R packages. Today, I want to share the most basic of geospatial capabilities, which is producing a map. Using R, you can do this in just 5 lines of code.
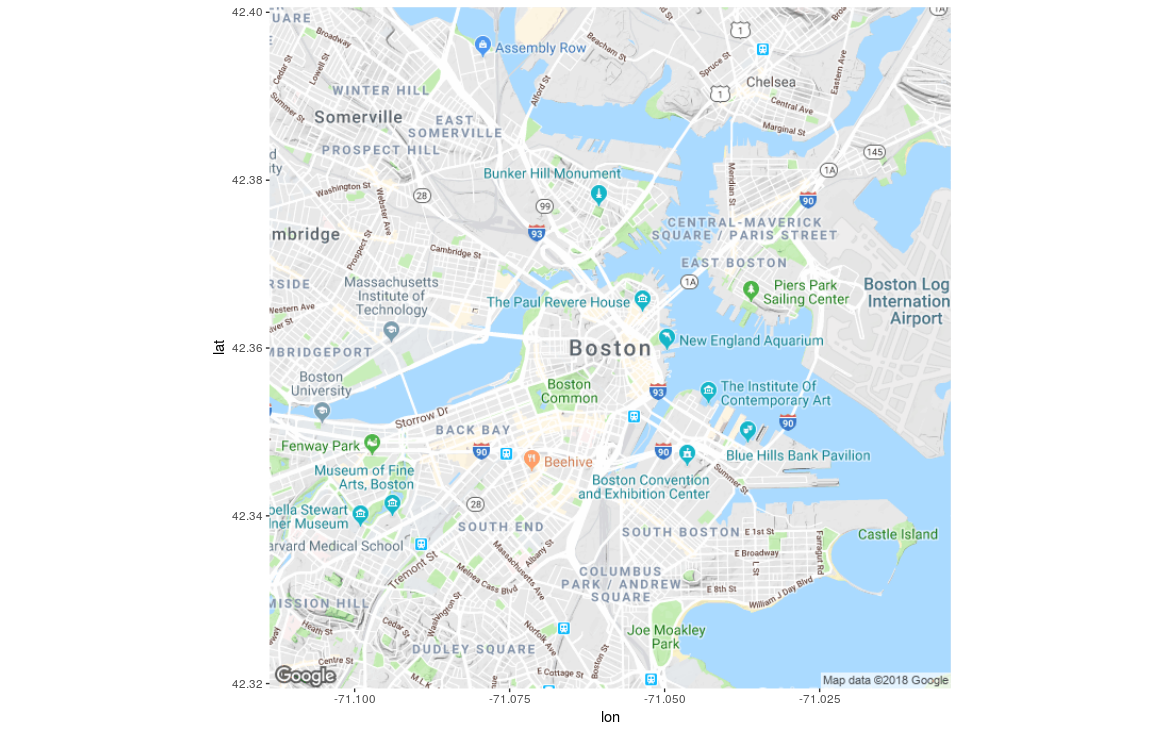
Let's produce a map of Boston, Massachusetts. Boston has a longitude of -71.0588801 and a latitude of 42.3600825. Since we list x and y coordinates in order (i.e. we list y after x), we list longitude (the horizontal coordinate) before latitude (the vertical coordinate). Let's create our map!
Code line 1:
install.packages("ggmap")
This command installs the ggmap package in your R environment.
Code line 2:
library(ggmap)
This command loads the ggmap package in your R environment.
Code line 3:
boston <- c(lon = -71.0588801, lat = 42.3600825)
This line creates a variable called "boston" and assigns the lon and lat coordinates in it.
Code line 4:
boston_map <- get_map(boston, zoom = 13, scale = 1)
This line creates a variable called "boston_map" and assigns the get_map command to it.
Code line 5:
ggmap(boston_map)
This line generates the map.
And that's it! If you reproduce these five lines in your R environment, you will generate a map that looks like this:


Comments
Post a Comment