3D Web Scene of Earthquakes, Tornadoes, Typhoons and Cities
Here's my very first 3D Web Scene that visualizes natural disasters and two cities (Portland and Montreal): http://arcg.is/01jbSq
A 3D Web Scene is Esri-speak for a 3D web map. You can zoom and pan, re-orient, change basemaps, change the daylight settings, explore different views and do lots more. Here's a screen shot of all typhoons represented on the 3D Web Scene:
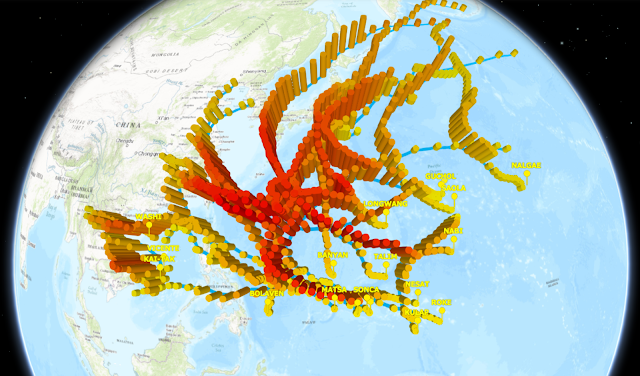
In this screenshot, typhoons are represented as cylinder symbols, with greater heights representing higher wind speeds and darker colors representing lower barometric pressures.
If you don't want to leave my beautiful blog (I don't blame you), you can check out the embedded version of the 3D Web Scene right here:
Check it out. I'd love to know what you think!


Comments
Post a Comment