Using decision trees in evidence based medicine
In today's post, we explore the use of decision trees in evidence based medicine. In 1996 David Sackett wrote that "Evidence-based medicine is the conscientious, explicit and judicious use of current best evidence in making decisions about the care of individual patients" [Source: Wikipedia].
For our analysis, we start with a data set which contains data about a number of patients all of whom suffered from the same illness. Each of these patients responded well to one of five medications. We will use a decision tree to understand what factors in each patients history led to them responding well to one specific medication over the others. We will then use our findings to generate a set of evidence based rules or policies that can be followed by doctors to treat this illness in future patients. As part of our analysis, we will also explore how to interpret decision trees.
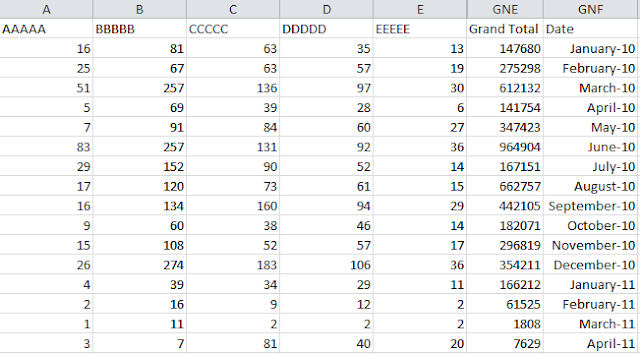
Let us first look at our data set:

As can be seen, the data set contains information about the age and gender of each patient along with Blood Pressure, Cholesterol, Sodium and Potassium levels. Finally, we have information about the drug the patient responded well to.
Next we use a couple of graphical outputs to understand our data better. We first look at the distribution of the data set broken down by the drug that was used to treat the illness:
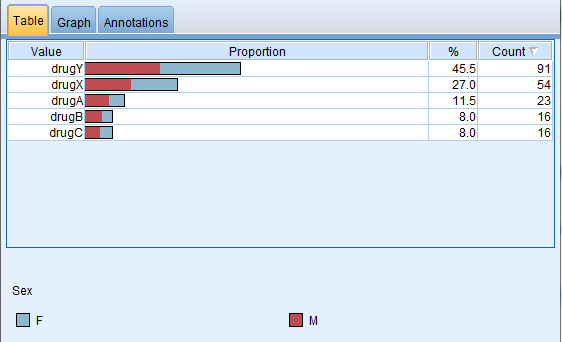
From the distribution graph above, we can see that drug Y is the most popular drug in treating the illness while there are a few cases that were treated by drugs B and C as well. In each of the cases, the distribution of male and female patients appears to be approximately equal. So it does not appear that gender is a factor in determining which drug will work in treating the illness.
Next we generate a scatter plot using the two continuous variables (Sodium and Potassium levels) as the X and Y axes and use Drug as the overlay variable:

From the scatter plot, one thing appears clear: where Potassium levels are 0.05 or below, the drug that works best is Drug Y whereas that drug rarely works in cases where the Potassium levels exceed 0.05. Another thing that is clear is that the ratio of Sodium to Potassium levels have a bearing on which drug works well. Based on this conclusion, we derive a new field in out data set as follows:

Our new data set is as follows:

We are now ready to create a decision tree model based on our data set. In order to do this, we first identify our target variable (Drug) and our predictor variables as follows:

We then add a C5.0 modeling node to the data to create our decision tree. Upon running our model, we observe that the most important predictors in determining which drug to use are as follows:

As can be see from this chart, the ratio of Sodium to Potassium is the most important predictor in determining which drug should be used to treat the illness. This reinforces the insight we obtained from the scatter plot above. Another insight that is reinforced is that the gender of the patient is not an important predictor in determining which drug should be prescribed to treat the illness.
Next we take a look at the decision tree generated by the C5.0 algorithm:

The decision tree above has broken down the entire data set based on the important predictors and has identified the exact situations in which a specific drug should be prescribed to treat the illness. We interpret the tree as follows:
Node 0
Node 0 is simply a distribution of the entire data set based on the drug used to treat the illness. This displays the same output shown by our distribution chart above.
Node 1 and Node 9
Next, the decision tree breaks down the list based on the most important predictor variable: the ratio of Sodium to Potassium. The threshold identified by the C5.0 algorithm is 14.64. Where the ratio of Sodium to Potassium exceeds 14.64, 100% of the patients respond well to Drug Y (Node 9). Since we have clearly identified those patients that respond well to Drug Y, Node 9 is a terminal node, i.e. no further analysis is required.
On Node 1 on the other hand, we see that Drug X is the most popular drug; however other drugs have also been used. Since there is no clear answer as to the best drug, the algorithm continues the analysis based on the next most important predictor variable, Blood Pressure.
Node 2, Node 5 and Node 8
The decision tree then creates three new nodes based on the Blood Pressure levels of the patients. Where Blood Pressure is Normal, 100% of the patients respond well to Drug X (Node 8). Since we have clearly identified those patients that respond well to Drug X, Node 8 is a terminal node, i.e. no further analysis is required.
Nodes 2 and 5 however need further analysis. Node 2 consists of patients that responded well to Drugs A and B while Node 5 consists of patients that responded well to Drugs C and X.
Node 3 and Node 4
We first examine Node 2 in further detail. The decision tree breaks this category down by Age. Where the age of the patient is less than or equal to 50 years old, the drug that works best in 100% of the cases is Drug A. Since we have clearly identified those patients that respond well to Drug A, Node 3 is a terminal node, i.e. no further analysis is required. Similarly, where the age of the patient exceeds 50 years old, the drug that works best in 100% of the cases is Drug B. Since we have clearly identified those patients that respond well to Drug B, Node 4 is also a terminal node, i.e. no further analysis is required.
Node 6 and Node 7
Finally, we first examine Node 5 in further detail. The decision tree breaks this category down by Cholesterol. Where the cholesterol level is normal, the drug that works best in 100% of the cases is Drug X. Since we have clearly identified those patients that respond well to Drug X, Node 6 is a terminal node, i.e. no further analysis is required. Similarly, where the cholesterol level is high, the drug that works best in 100% of the cases is Drug C. Since we have clearly identified those patients that respond well to Drug C, Node 7 is also a terminal node, i.e. no further analysis is required.
Evidence based rules for drug prescription
Based on this decision tree, we are able to generate the following evidence based rules for drug prescription:
Drug A

Drug B

Drug C


Drug X


Drug Y


Based on these rules, both doctors and nurse practitioners have a clearly defined set of guidelines to treat patients in order to obtain improved patient outcomes leading to efficiencies, lower costs and improved patient satisfaction with healthcare providers.


Comments
Post a Comment